Published May 30, 2023
Author Solidigm Team
Article
PC Storage Performance in the Real World
Performance is a key factor for PC users trying to determine which solid-state drive (SSD) is the best choice for their specific needs. Even so, the choice is not always straightforward. Price, of course, is a primary concern. And depending on your intended usage, other drive characteristics—such as endurance or security features—might take priority.
But it all comes back to the question of performance.
Perhaps more accurately, there are several such questions. How much is enough? How is it measured? Does every activity a user might do—we’ll use the term “workload” in this paper to refer to each individual one—demand the same things of the storage device, or are there many kinds of performance to consider?
The answers, in short are: It depends; very carefully; and yes, there is more to the story than the single speed figure that manufacturers often put on the retail box. The performance number on an SSD retail box usually represents maximum bandwidth, which is rarely seen in real-world usage.
Product specs and “four corners”
That number is both valid and useful for telling a prospective user something about the drive’s performance, but as it turns out, it has relatively little to do with how snappy the system will “feel” in day–to–day performance. We’ll get into the reasons for that later.
An enterprising shopper might dig a little deeper by locating the SSD’s product specification, or spec sheet (it’s common practice for vendors to publish these for each drive). There, they would typically find as many as four performance numbers listed.
Now we’re getting somewhere. Having reviewed the spec sheet, we find the so-called “four corners” figures, and consequently understand that “performance” is more than one thing – a drive can read and write data at different speeds, and there’s a distinction between sequential and random activity (a function of something called transfer size; more on this in the section “A Quick Primer on I/O Characteristics”).
These distinctions are useful for getting a more accurate picture of SSD performance. But based on the Solidigm research outlined in this paper, they’re still not enough.
As we will discuss, most real-world workloads comprise a mix of read and write activity, often concurrently. Sometimes the storage device is not the bottleneck at all, meaning user experience could be constrained by another system resource, such as the CPU or GPU. And critically, there is the issue of queue depth (QD) to consider – that is, how many I/O requests are pending at the SSD controller at any given time.
We’ll spend a lot of time on queue depth, because it is a critical driver of SSD performance. The higher the QD, the more operations an SSD can run in parallel, resulting in higher throughput – that’s why the retail box and spec sheet numbers that SSD vendors use are almost always measured at very high QD (32 is common). But it turns out the vast majority of real-world usage occurs at a QD of just 1 or 2, according to our findings. Consequently, theoretical max performance is not as important as low-QD performance in most cases.
We will also briefly discuss popular SSD benchmarking tools and how well their results align to what we know about real-world performance.
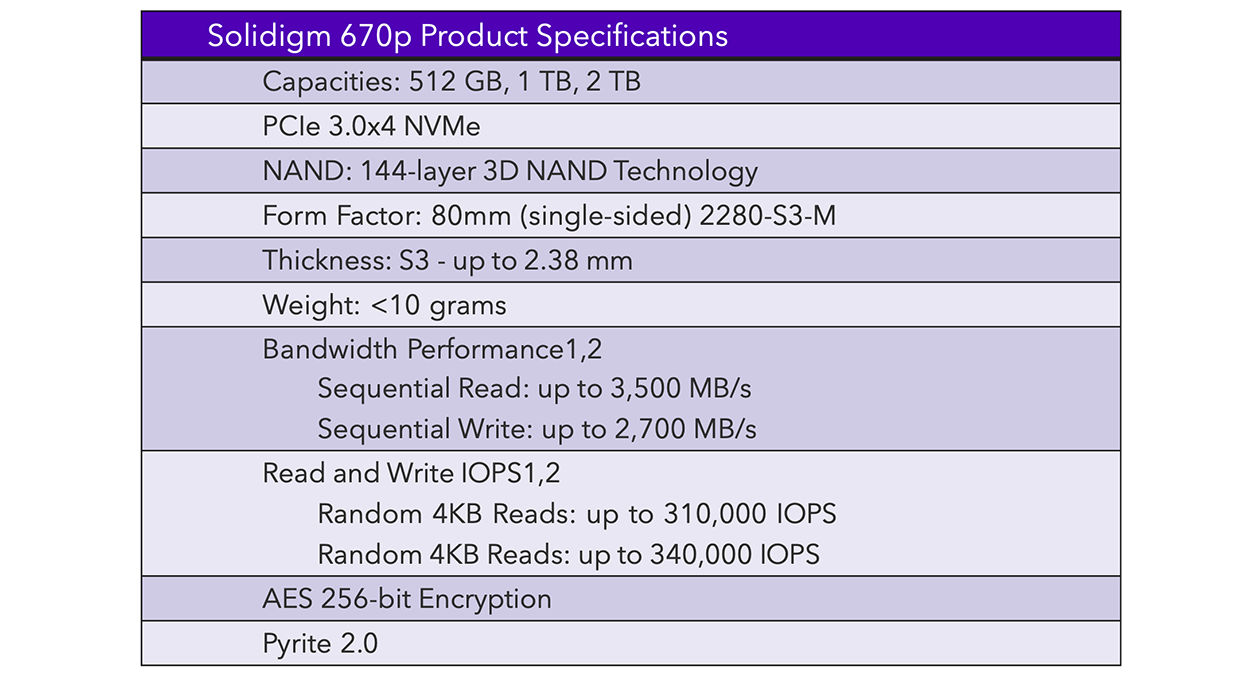
Figure 1. Excerpted from the Solidigm 670p product specification
A Quick Primer on I/O Characteristics
There is no shortage of ways you could examine the characteristics of a given workload. What’s important for the conversation of SSD performance is identifying the few critical metrics that have the greatest influence on user experience.
For example: Using our internal tool to “trace” workloads as they run and record the underlying system activity (see more in the “Research Methodology” section), we observed what happened when we launched Adobe Acrobat and loaded a PDF file. This common activity resulted in a trace output file with literally thousands of individual data points, despite a workload duration of only about 9 seconds.
Not all of those have a major effect on user experience – but among them are certainly the key drivers. Let’s look at each of these three in depth.
1. Read/write mix
Read/write mix is probably the most intuitive for most users. Depending on what you are doing on your PC, it’s making requests to either put data on the drive or retrieve data that’s already there for use. You can likely guess which kinds of activity would cause one or the other: Launching applications and loading files are read-heavy activities, while saving data results predominantly in writes. Something like a file conversion from one format to another would require both – reads from the source file, and writes to the output file.
2. Sequential-random mix
Sequential-random mix is another critical characteristic. This refers to how data is written to or read from the drive: Sequential transfers take place over a longer series of consecutive locations on the drive (called logical block addresses, or LBAs), while random operations tend to be composed of smaller reads or writes to non-consecutive locations. The transfer size is usually on the order of several kilobytes. (Astute readers may notice that some SSD vendors list transfer size with their performance specs – for example, “4KB Random Read” vs. “128KB Sequential Read”). An activity that consists of reading or writing many small files will tend to be more random in nature, while workloads with larger individual files will be more sequential.
3. Queue depth
Queue depth is less intuitive, but no less important to user experience. Any workload, even a small one, will generate a huge number of I/O operations (in the case of our 9-second Acrobat launch and load example, more than 6,000 of them). The SSD will process those as quickly as possible, but sometimes a queue, or line, forms of waiting requests. Thanks to clever architecture, modern SSDs can service multiple requests in the queue at a time (a concept called “parallelism”). Consequently, performance measured in terms of data throughput will be highest at high QD, when multiple requests are processing at once. But as we will learn later, many typical PC workloads just don’t form long queues because the SSD is responding as quickly as the requests come in.
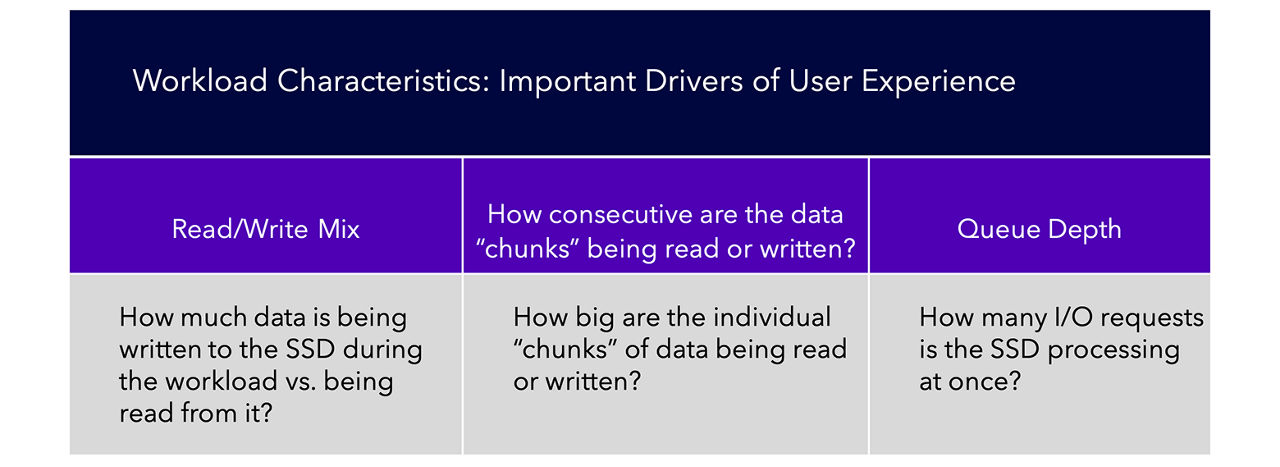
Figure 2. Workload Characteristics
These three I/O characteristics form the basis of our analysis in this paper. It’s important to keep in mind that a fourth vector unrelated to storage performance can have a huge bearing on user experience: If the bottleneck is actually occurring elsewhere in the system (for example, the CPU is under full load or the local memory has been exhausted), then better storage performance will not result in better user experience.
Research Methodology
To ascertain what’s going on under the hood during real-world PC usage, we first had to determine two things: which workloads to study, and how to collect and analyze the data.
For workload selection, we opted for a balanced approach that considers three important usage “segments:” general productivity, gaming, and content creation.
Our workload sample is by no means exhaustive, and the results should not be generalized to all real-world PC usage. Instead, we sought to study a collection of activities that were more or less representative of typical day-to-day activities that users in each of these three segments would do. We also wanted to ensure a variety of results were likely, from read- to write-heavy I/O patterns and dealing with a balance of small and large files.
Cues for running the trace
For each workload, we defined “start” and “stop” cues for running the trace, and attempted to ensure that no other activities were running on the system at the same time that might confound the results.
The data collection itself was accomplished using built-in Microsoft Windows features. Microsoft makes available a tool in the Windows Assessment and Deployment Kit (Windows ADK) called the Windows Performance Recorder (WPR), which records Event Tracing for Windows (ETW) events in real-time during workload execution.

Figure 3. Real-World PC Workloads for Analysis
As mentioned earlier, the resulting trace output files contain literally thousands of data points. Among them are:
- How active were various system resources, including the SSD, CPU, GPU, main memory, and network
- Total workload size (in both MB and count of I/O operations), plus read/write mix by size and by count
- QD for every single operation
- Transfer size for every single operation
- Average response time by transfer size
- Data transferred (both size and count) segregated by process
- Individual files that were touched, and how much data was read or written per file
- And much, much more!
Organize the trace
We then used an internal tool to organize the trace data into an Excel workbook for analysis and visualization.
In practice, this is what it looked like:
- Prepare the system for tracing by ensuring a quiescent state (i.e., no other activities running in the background)
- Start the trace
- Execute the workload (for example, double-click the Adobe Acrobat icon to launch the program, then load a PDF from the “File” menu)
- Once the final execution step completes, stop the trace
- Generate an Excel file with results for analysis
A fair criticism of our approach would be that by pre-selecting which workloads to study, we have biased the aggregate results in a way that renders them less useful for making statements about what typical PC usage looks like “in general.” After all, there are probably many users out there who do none of the twelve things we studied on a regular basis. How useful, then, is a really solid understanding of what’s happening in these specific cases, when it might or might not indicate trends in the larger world of PC usage?
Reminders when reading the results
A response in two parts. First: Stay tuned! Solidigm intends to continue this research by moving into another phase of “user session” characterization – in other words, if we just take a look at what a representative group of people does all day and measure that, without asking anyone to run specific workloads, what could it tell us? We anticipate publishing the results of this research in the coming months.
And second: While the aggregate results of the research in this paper might not align precisely to PC usage in the most general sense, we do believe what we’re presenting here is correct directionally – and hence useful as a starting point for this discussion. Some of the results are so overwhelming (for example, 92% of all I/O operations across the 12 workloads occurring at a QD of 1 or 2) that it’s worth considering the implications, even before moving to the broader research phase.
And now, on to the workloads.
General Productivity Workloads
Let’s start with a review of the four productivity workloads and discuss our findings in each.
The Acrobat “launch-and-load” workload is a good starting point – a common use case with unsurprising results. The total workload size is approximately 300MB, divided into 88% reads and the remainder writes. The activity is predominantly random with a 4KB transfer size.
While the max QD measured was 191, the geometric mean value was 2.1. (This phenomenon will appear in many of the workloads studied – a sky-high peak QD measured for the tiniest fraction of a second, while an overwhelming majority of operations were at just 1 or 2).
Launch Adobe Acrobat + Load PDF

Figure 4. Performance Metrics for Adobe Acrobat PDF Launch and Load
The second productivity workload tells a similar story. In this one, we launch Microsoft Outlook, which also triggers a load of the associated Outlook Data File (PST) that contains email messages and related items. Again, mostly random read.
Notably, more than 98% of I/O operations during this workload occurred at a QD of 1 or 2.
Our first write-heavy workload involves exporting a series of slides from PowerPoint to an MP4 video, a built-in feature of PowerPoint. The process took about 90 seconds.
The bandwidth graph tells a story that is logically consistent with this activity: lots of read activity during the first half, followed by mostly writes as the new video file is generated.
Launch Microsoft + Load PST & Export Microsoft Powerpoint PPTX to MP4


Figure 5. Performance Metrics for Microsoft PowerPoint Launch and Load
The final productivity workload represents a use case that is increasingly common since COVID-19 came on the scene: calling into a virtual meeting.
This activity involves some light I/O traffic, with more than 99% at low QD – but the likeliest bottleneck here would be the network, which will determine user experience on a call like this more than any other resource
Launch Zoom + join virtual meeting

Figure 6. Performance Metrics for Zoom Virtual Meeting Launch and Load
Gaming Workloads
Gamers are no strangers to waiting for things to load. That’s what makes a thorough analysis of this segment so interesting – there is lots of room for improvement.
Things like launching games and loading save states and new levels have caused extended wait times for as long as PC gaming has been around. But what’s going on under the hood at times like these? Let’s find out.
The first gaming workload we looked at was relatively light – we simply loaded the League of Legends game client from the desktop. This is just the first step toward gameplay; it only takes the player as far as the menu, so we wanted to examine it in isolation. The entire workload took 18 seconds and involved more than 500MB of data transfer, 85% of which were reads and 80% at low QD.
Launch League of Legends game client

Figure 7. League of Legends Launch and Load
In contrast to the productivity workloads we reviewed earlier, the read activity here is overwhelmingly sequential in nature, with a most-common transfer size of 128KB – this makes sense, given the huge assets (models, textures, etc.) that a modern AAA game employs to create an immersive environment.
Here we also start to see a workload demanding more of the other system resources, particularly main memory and GPU.
This workload involves launching a game and loading a new battle while simultaneously streaming and recording activity using Open Broadcaster Software (OBS). As is typical with AAA gaming workloads, the majority of reads were sequential.
This is also an example of a workload where one of the other system resources, the GPU, reached max utilization – indicating a bottleneck unrelated to storage performance.
Load Elden Ring new level & Launch Total War: Warhammer III


Figure 8. Performance Metrics for Elden Ring & Total War: Warhammer III Launch and Load
The final gaming “workload” is a slightly different look at this segment – instead of defining a specific activity, we asked a volunteer to simply play a game for 15 minutes to examine how data might be loaded in as one moves the character around in an open- world environment.
Play Grand Theft Auto V for 15 minutes
The result was no great spikes in disk activity, but a steady stream of smaller reads that added up to more than 4GB of data transferred over the time window. Those reads were a mix of sequential and random.

Figure 9. Performance Metrics for Grand Theft Auto Play for 15 min
Content Creation Workloads
Finally, let’s turn to the content creation segment – a varied category we use to refer to workloads that involve the production of media (video, photo, audio, and so on). Like gaming, this segment can involve some large data transfers and long wait times, depending on the project.
In the first content creation workload, we examine a very common activity: launching Adobe Photoshop and loading a multi-layer PSD (project file).
This 10-second activity involved about 1GB of data transfer; most of the read operations were random, but the smaller proportion of sequential reads nonetheless accounted for about half of the data read from the disk due to the larger size of those operations (mostly 128KB each).
Launch Adobe Photoshop - load PSD

Figure 10. Performance Metrics for Adobe Photoshop Launch and Load
Launch Blender
Blender is a free, open-source 3D creation software popular with creators across various industries.
Mean QD creeps all the way up to 2.6 here, but 77% of operations remain at QD 1 or 2.
In this particular case, 4KB reads are the predominant I/O type – though depending on the project file used, others might expect to see a greater proportion of sequential transfers.
This activity involved importing many video files from an external drive into an Adobe Premiere Pro project – something a creator might do when creating a family slideshow or editing together a feature film. The bandwidth chart tells the story of many files being read into the program during the first half of the workload, and lots of concurrent read-write activity on the back half.
Launch Blender + load project file & Import 100 video clips to Adobe Premiere Pro


Figure 11. Performance Metrics for Blender Launch and Load
The final workload in this paper is the largest, by far, in terms of both duration and size. Exporting a large Premiere Pro project file to AVI video took more than two hours and involved moving nearly a half-terabyte of data.
The lion’s share of disk activity occurred in the final 20% of the time window, as indicated on the charts. While the process was write heavy (to the tune of 57% of operations), there was a significant proportion of reads involved in the export as well.
Export Adobe Premiere Pro PRRROJ to AVI

Figure 12. Performance Metrics for Adobe Premier Export
Trends in Real-World PC Storage Performance
For PC users trying to determine which solid-state drive (SSD) is the best choice for their specific needs, the job is not always a straightforward one. Price, of course, is a primary concern. Depending on intended usage, other drive characteristics, such as endurance or security features, might take priority.
And then there is the question of performance.
Perhaps more accurately, there are several such questions. How much is enough? How is it measured? Does every activity a user might do – we’ll use the term “workload” in this paper to refer to each individual one – demand the same things of the storage device, or are there many kinds of performance to consider?
The answers, in short: It depends; very carefully; and yes, there is more to the story than the single speed figure that manufacturers often put on the retail box.
Beyond that, the other I/O characteristics were highly workload dependent. While the aggregate view of our workloads suggests a higher proportion of reads than writes in general, and more random than sequential activity – and while we would expect that to be true of general PC usage across all users and workloads – any definitive statement to that effect is pending the further stages of this research project mentioned in “Research Methodology.”
In terms of how sequential or random a workload is, it’s clear that the results are highly workload dependent – although these early results do suggest some distinction by usage segment, with gaming relying on more sequential transfers and productivity on predominantly random activity.

Figure 13. Queue Depth

Figure 14. Read/Write Mix

Figure 15. Sequential/Random Mix
Evaluating Common Benchmarks
With these results in hand, we can have a brief discussion about the usefulness of various popular SSD benchmarks in evaluating or predicting actual end-user experience.
1. ATTO Disk Benchmark presents a results screen that focuses on SSD read and write performance across various transfer sizes (user configurable). Based on our research, the most important ones to real-world usage are 4KB, 16KB, 32KB, and 128KB.
2. Anvil’s Storage Utilities presents a default test that covers 4KB random transfers at various queue depths (including 4 and 16), as well as sequential operations of 32KB, 128KB, and 4MB at indeterminate QD. It also outputs aggregate read and write “scores” as well as an overall score.
3. AS SSD Benchmark has a clean, simple interface with a limited number of tests by default. The UI does not specify transfer size for the sequential tests or queue depth for either sequential or random tests.
4. CrystalDiskMark is popular with users and the tech press for its balance of approachability and thoroughness. The current version, 8, presents a default test set that includes sequential transfers of 1MB at QD 1 and 8, and random 4KB transfers at QD 1 and 32. The tool also includes other test “profiles” that permit users to measure a mix of read and write activity, a useful feature.
5. PCMark 10 includes a set of four storage benchmarks: Full System Drive, Quick System Drive, Data Drive, and Drive Performance Consistency. Unlike the other tools listed here, PCM10 tests rely on real-world traces from common applications to calculate a score. While this approach permits less customization up front – users can’t specify a given queue depth or transfer size to focus on – it has the benefit of aligning well by nature with real-world usage. To better understand this approach, we traced the PCM10 Quick System Drive Benchmark as it ran, with the following results.
PCMark 10 Quick System Drive Benchmark

Figure 16. PCMark 10 Quick System Drive Benchmark
The PCMark 10 approach aligns fairly well to the aggregate results of our 12-workload sample. Mean QD is 1.2 (with 96% of operations at QD 1 or 2), and most operations are random reads.
Given this alignment, our conclusion is that the results of this test are useful for gauging an SSD’s performance on real-world applications – although, as with any test that outputs a calculated score, users should ensure they know how it’s calculated before using it as the sole basis for any comparison.
PCMark 10 storage benchmarks accelerate the traces’ I/O patterns, eliminating other factors in the source workload, such as compute time and host idle time. This serves to stress the storage system to a greater degree and provides more sensitivity to improvements in storage performance, which is part of what makes the benchmark useful. This difference shows in the Solidigm trace of PCMark 10, where average CPU time and GPU time are 7% and 0%, respectively.
One notable difference is the measured proportion of 4KB transfer sizes in the PCMark 10 workload as compared to the Solidigm-measured application traces. While the Solidigm measurements often have a majority of 4KB transfers, they fall short of the overwhelming majority in PCMark 10. It’s difficult to speculate on this difference without further study; keep an eye out for the next Solidigm white paper on real-world performance
Conclusions & Next Steps
- The way an SSD will perform under real- world circumstances is almost impossible to communicate in one number. Even the “four corners” numbers listed in most product specifications only tell part of the story.
- It is important to know what an SSD is capable of at maximum performance, and it is useful for certain real-world activities. But in the workloads we studied here, it was clear that many other factors can and do influence what a user would perceive as storage performance or a generic sense of system “responsiveness.”
- Users can make an informed decision about which SSD is right for them based on their intended use. Our research suggests a few useful rules of thumb.
- Queue depth of 1 or 2 was overwhelmingly represented in real-world I/O operations; consequently, a drive’s low-QD performance is worth considering in addition to the “four corners” performance numbers
- The activities studied here indicated a mix of read and write activity; tests that focus on mixed activity should be used alongside ones that stress pure operations of one type or the other
- While there is some apparent differentiation by segment, both sequential and random operations were present in each of the workloads studied. Consequently, it’s useful to understand which transfer sizes are prevalent in real-world usage and evaluate SSDs accordingly
- This publication represents Solidigm’s first foray into the study of real-world PC usage, but it certainly won’t be the last. In future white papers, expect to hear more from us about the emerging trends in general PC usage, outside of prescribed workloads such as these. We will also continue to study common benchmarking tools to better understand their relative usefulness in predicting the quality of end-user experience on a given SSD.