Published February 26, 2023
Author Solidigm Team
Article
P44 Pro Series – Exceptional Performance
Data storage is at the forefront of modern technological advancements that are enhancing computer gaming and content creation. Solid-state drives are vital to supporting these cutting-edge use cases, so choosing an SSD with the appropriate performance characteristics is essential.
Gamers, content creators, and other high-performance computer users depend on enhanced storage performance to support their current workloads while positioning themselves and their devices for future growth.
Solidigm engineers thoroughly analyzed client workloads and SSD design across many demanding user groups, including gaming enthusiasts and content creation professionals in video production and graphic design. From this in-depth analysis, the Solidigm P44 Pro was born. Specifically engineered for today’s most demanding personal computer applications, this high-performance SSD is ideal for real-world gaming and content creation use case workloads on modern PCs and workstations.

The Solidigm P44 Pro is designed to enable an exceptional user experience for high-performance gaming, content creation, and PC workstations.
Based on use-case analysis, this experience requires optimization primarily for 128KB sequential and 4KB random I/O workloads.
To compare the P44 Pro against other drives designed for more demanding compute workloads, Solidigm engineers conducted a series of benchmarking tests and analyzed the results which are laid out below.
Solidigm P44 Pro Specifications [1]
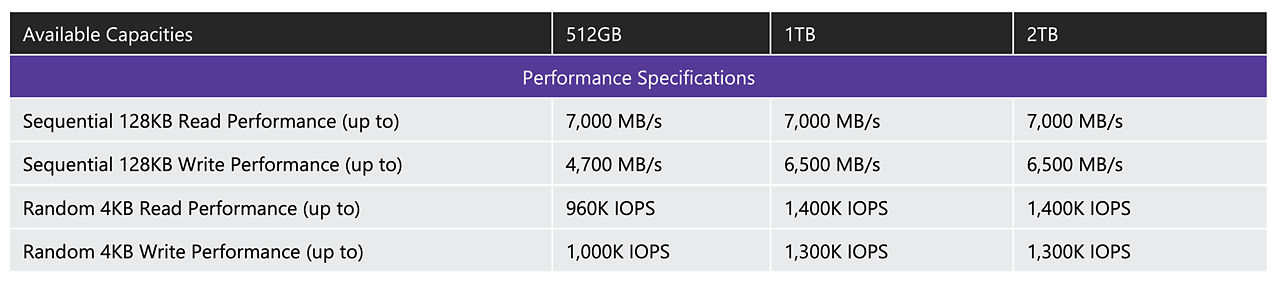
Performance Considerations
Solid-state drives can be optimized for a variety of workloads. Performance comparisons intended to inform SSD choice should provide metrics aligned with the intended workload the SSD will support.
Three critical metrics that can have a major effect on user experience are:
- Read/write mix – The amount and transfer size of data written to the SSD during the workload versus being read from it.
- Sequential-random mix – Larger data transfers take place over a longer series of consecutive locations on the drive and are sequential in nature, while smaller reads or writes tend to be stored in non-consecutive locations and are random in nature.
- Queue depth (QD) – Workloads generate I/O operations that are queued for completion by the SSD. Modern SSDs can service multiple requests in a queue at a time—and performance measured in terms of data throughput will be highest at high queue depths, when multiple requests are processing simultaneously.
Solidigm engineers analyzed several use cases as an input for workload-specific SSD optimizations.
For all workloads tested, 92% of I/O activity is at QD1 or 2 with trivial amount beyond QD4. (2)
The workload associated with launching games, loading save states, and loading new levels tended to be sequential in nature, with a common transfer size of 128 KB.
Content creation workloads vary significantly based on the application used and media file size. Common content creation activities, such as loading a multi-layer Adobe Photoshop project file, can result in workloads that are predominantly random reads with a lesser amount of mostly 128 KB sequential reads .
Opening a Blender project showed a workload of mostly 4 KB reads, but this changed depending on the size of the scene, number of objects, and textures used in the project.2 Exporting an Adobe Premiere Pro project to AVI format showed a higher mix of random reads and writes that were most frequently 128 KB in size, but also included a significant number of 256 KB and 1 MB file transfers.
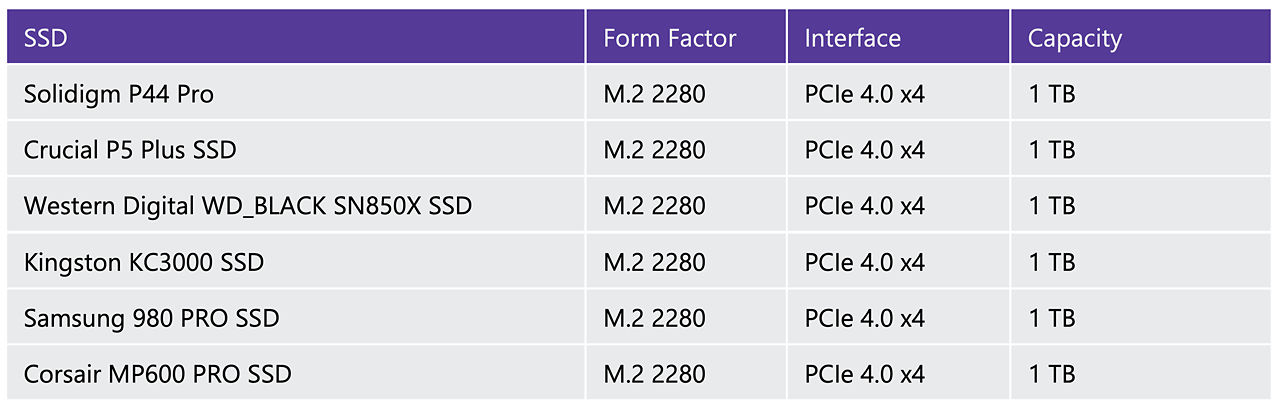
SSDs Tested for Performance
Testing Methodologies
A series of benchmark tests observed how the P44 Pro’s performance stacked up against comparable SSDs from other manufacturers. Benchmarking software tools generated workloads aligned with real-world use cases and workloads that tested the upper performance capability of each SSD. Software tools used included PCMark10, CrystalDiskMark8 and the Final Fantasy XIV: Endwalker Benchmark.
A series of productivity tasks used Adobe InDesign, Adobe Bridge, Adobe Premiere Pro, Adobe After Effects, Autodesk 3ds Max, and Microsoft Word for Microsoft 365 to measure application load and task completion time.
CrystalDiskMark 8 Sequential Read/Write Performance 1MiB Q8/T1 - Desktop
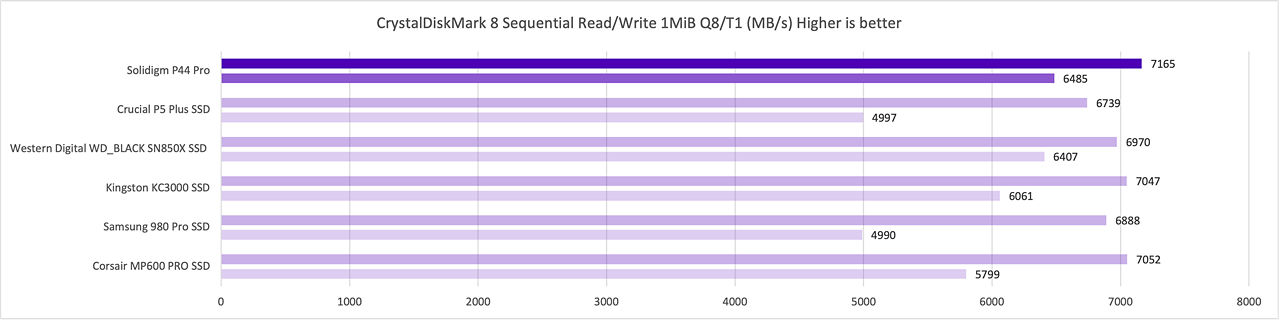
Figure 1. CrystalDiskMark 8 Sequential Read/Write 1MiB Q8/T1 in MB/s - Desktop
The Solidigm P44 Pro achieves the highest sequential read and write throughput compared to all SSDs included in this benchmark. A higher sequential read and write speed means users can expect to see improvements in areas such as system boot up time, application launch speed, and faster file save rate.
CrystalDiskMark 8 Random Read/Write Performance 4KiB Q32/T16 – Desktop
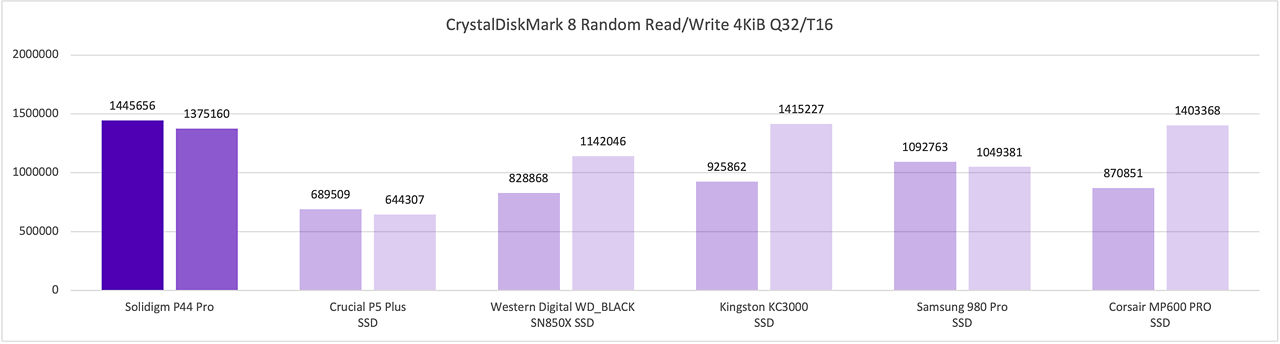
Figure 2. NVMe Peak Performance Random Read/Write 4KiB (Q32/T16) in IOPS - Desktop
The CrystalDiskMark 8 Random Read/Write, 4KiB Q32/T16 performance test results show the Solidigm P44 Pro exceeding 1.4 million IOPS for low latency reads, the highest performance compared to all SSDs included in this benchmark. Random read/write performance has the greatest impact on everyday tasks, for example: opening a word doc or spreadsheet while using your browser.

Figures 3. NVMe Peak Performance Random Read/Write 4KiB (Q32/T16) in μs - Desktop
The CrystalDiskMark 8 Random Read/Write, 4KiB Q32/T16 performance test results show the P44 Pro with the lowest latency for reads, and the Corsair MP600 PRO SSD with a 2% lower write latency.
These test results indicate the P44 Pro’s suitability for promoting an exceptional user experience for high-performance gaming, content creation, and PC workstations.
PCMark 10 Performance Benchmark
PCMark 10 provides a full suite of benchmarks using real-world traces from common applications and tasks to test various PC system components. The PCMark Quick System Drive Benchmark (3) and the PCMark Full System Drive Benchmark (4) tests produce a score calculated from the bandwidth and average access-time scores. The PCMark Quick System Drive Benchmark is a shorter test with a smaller set of real-world traces. This benchmark focuses on file copy operations for various file types using Microsoft Excel, Adobe Illustrator, and Adobe Photoshop.
PCMark 10 Full System Drive Benchmark Results – Desktop
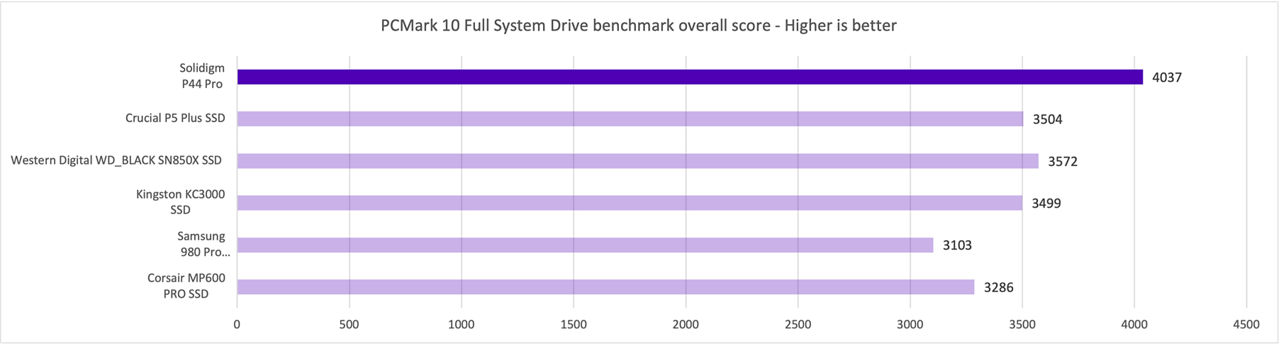
Figure 4A. PCMark 10 Full System Drive Benchmark Overall Results - Desktop
In the PCMark 10 Full System Drive Benchmark, the P44 Pro scored 13% higher than the Western Digital WD_Black SN850X SSD and 30% higher than the Samsung 980 Pro SSD.
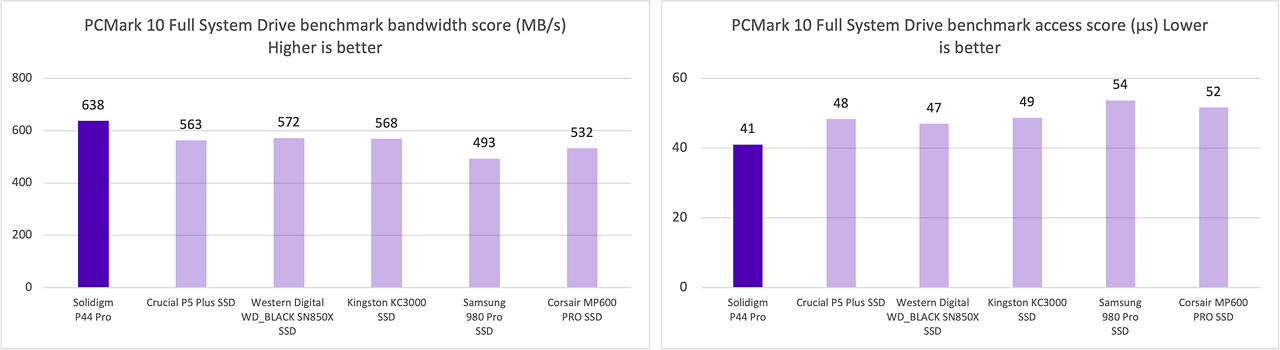
Figures 4B and 4C. PCMark 10 Full System Drive Benchmark Bandwidth and Access Results - Desktop
The scores for the PCMark Full System Drive Benchmark shows that the Solidigm P44 Pro achieved higher throughput (MB/s) and lower latency (μs) than all SSDs tested.
CrystalDiskMark 8 Performance Benchmark
CrystalDiskMark 8 is a popular benchmark tool that is based on Microsoft’s DiskSpd tool. The software measures sequential and random read, write, and mixed read/write performance using various patterns.
CrystalDiskMark 8 Sequential Read 1MiB Q8/T1 - Desktop

Figure 5A. CrystalDiskMark 8 Sequential Read 1MiB Q8/T1 in MB/s - Desktop
The P44 Pro and Kingston KC3000 sequential read results were close, with the P44 Pro achieving 2% higher throughput. Performance results for all SSDs in this test were closely grouped with just a 6% difference from highest to lowest results.

Figures 5B and 5C. CrystalDiskMark 8 Sequential Read 1MiB Q8/T1 in IOPS and μs - Desktop
The IOPS and latency results from the same test show all SSDs in the comparison performing within a narrow range.
CrystalDiskMark 8 Random Read 4KiB Q32/T16 - Desktop

Figure 6A. CrystalDiskMark 8 Random Read 4KiB Q32/T16 in MB/s - Desktop
The P44 Pro achieved 5921 MB/s throughput in the CrystalDiskMark 8 Random Read, 4KiB Q32/T16 Benchmark. This result is 32% higher for the P44 Pro versus the Samsung 980 Pro, the closest performing SSD, and over 2 times higher for the P44 Pro versus the Crucial P5 Plus, the lowest performing SSD in the test group.

Figures 6B and 6C. CrystalDiskMark 8 Random Read 4KiB Q32/T16 in IOPS and μs - Desktop
In the same test, the P44 Pro achieved 32% higher IOPs at lower latency than the second-fastest Samsung 980 Pro SSD, and over 2 times higher IOPs at lower latency than the Crucial P5 Plus SSD.
CrystalDiskMark 8 Sequential Write 1MiB (Q8/T1) - Desktop

Figure 7A. NVMe Peak Performance Sequential Write (Q8/T1) in MB/s - Desktop
The P44 Pro versus Western Digital WD_Black SN850X SSD sequential write results in this sequential write test were close, with the P44 Pro achieving 1% higher throughput.
The P44 Pro achieved 30% higher throughput than the Samsung 980 Pro SSD.

Figures 7B and 7C. NVMe Peak Performance Sequential Write (Q8/T1) IOPS and μs - Desktop
The P44 Pro achieves the highest throughput at the lowest latency compared to all SSDs in the CrystalDiskMark 8 Sequential Write Benchmark test.
CrystalDiskMark 8 Random Write 4KiB (Q32/T16) - Desktop

Figure 8A. NVMe Peak Performance Random Write (Q32/T16) in MB/s - Desktop
The results from the CrystalDiskMark 8 Random Write 4KiB Q32/T16 Benchmark show the Samsung 980 Pro SSD and Kingston KC3000 SSD achieving higher throughput than the P44 Pro.

Figures 8B and 8C. NVMe Peak Performance Random Write (Q32/T16) in IOPS and μs - Desktop
The test results displayed in Figures 8A, 8B, and 8C, show the Samsung 980 Pro SSD and Kingston KC3000 SSD achieving higher throughput at lower latency than the P44 Pro with a 3% difference in performance.
Final Fantasy XIV: Endwalker Official Performance Benchmark
The Final Fantasy XIV: Endwalker Official Performance Benchmark is designed to measure how well Final Fantasy XIV: Endwalker will run on a computer, but it is also useful in determining and comparing overall system performance. The software uses maps and playable characters from the game to determine a performance score for the PC, as well as the average framerate during gameplay. For this benchmark, Solidigm engineers also measured how long the application took to load.

Figure 9A. Final Fantasy XIV: Endwalker official performance benchmark - Laptop
The Final Fantasy XIV: Endwalker Official Performance Benchmark showed the P44 Pro achieving the third fastest launch time compared to all SSDs in this test.

Figure 9B. Final Fantasy XIV: Endwalker official performance benchmark - Desktop
In the same test, the P44 Pro achieved the second fastest launch time compared to all SSDs tested.
Application Usage Tests
To compare the P44 Pro’s to performance to other SSDs in real-world content creation workloads, Solidigm engineers prepared, completed, and timed a series of productivity tasks. The tasks were completed three times per SSD with each instance run on a system that had been fully restored.
The results recorded for most application tests do not show significant difference between SSDs included in the comparison. Based on the observed benchmark test results, it may be that this test did not create sufficient load to highlight specific performance characteristics of the SSDs being compared.
Adobe InDesign – Link Files, Export PDF & Package File
A 236 MB InDesign file was opened in InDesign on a PC. When opening the file, the application detected internal document links that needed to be modified. The first test tracked the time taken to modify those links, while a separate test measured opening a version of the same file where the links were already modified.

Figures 10A and 10B. Updating file links in Adobe InDesign, and re-opening the project file with all links updated - Laptop
The Corsair MP600 Pro SSD delivered the fastest performance in the file linking test with a 4% difference between the fastest and slowest recorded times overall. The P44 Pro achieved the fastest project load time, but the performance difference from the fastest to slowest recorded time was less than 1 second.
Once the links had been modified in the first test, the InDesign file was exported to PDF for review. Default application settings were used for the export. When the PDF export was complete, the InDesign file was saved and packaged for archiving. The default application settings were used for the packaging process.

Figures 10C and 10D. Exporting a PDF from Adobe InDesign, and Packaging an InDesign file - Laptop
All SSDs included in this comparison performed within a very close margin. The P44 Pro and Kingston KC3000 SSD completed the PDF export task 3% faster than the SSD with the longest export time. The Crucial P5 Plus SSD and the P44 Pro SSD completed the file packaging task 5% faster than the SSD with the longest file packaging time.
Adobe Bridge – Batch Image Processing and Contact Sheet Creation
For the Adobe Bridge test, 354 NEF files with a total size of 9.57 GB were converted to JPEG format using the batch conversion process. The default application settings were used for the export. Using the same RAW files in the test above, a contact sheet was generated. A 4 x 5 grid was used instead of the default 2 x 2 grid, but otherwise all settings remained as per the application defaults.

Figures 11A and 11B. Batch image processing, and contact sheet creation in Adobe Bridge - Laptop
The Crucial P5 Plus SSD completed the batch image processing task 3% faster than the SSD with the longest image processing time and was 3 seconds faster than the P44 Pro in a task that averaged 7 minutes 9 seconds.
Microsoft Word – Image important and PDF Export
For the first Microsoft Word test, 354 large image files in NEF format with a total file size of 9.57 GB were imported into Microsoft Word. For the second test, a 20-page Microsoft Word document with a total file size of 833.8 KB was opened and then exported to PDF format using the 'Export to Adobe PDF' feature in Microsoft Word. The default application export settings were used.

Figures 12A and 12B. Image importing and PDF exporting in Microsoft Word - Laptop
The Kingston KC3000 achieved the fastest image import time, which was 2% faster than the SSD with the longest image import task completion time. The Corsair MP600 Pro achieved the fastest PDF export time, which was 4% faster than the P44 Pro.
Adobe AfterEffects – Application and Project Load
Adobe AfterEffects was launched and a 15.8 MB Adobe AfterEffects project file was loaded. The application launch and project load times were measured.

Figures 13A and 13B. Application launch and project load in Adobe AfterEffects - Laptop
The P44 Pro achieved the fastest application and project load times in this comparison. However, the difference between the fastest and slowest application and project load times is less than half a second. It may not represent a perceptible delay that negatively impacts the end-user experience.
3ds Max – Application and Project Load
Autodesk 3ds MAX was launched and a 2.2 GB 3ds Max scene file was loaded. The application launch and project load times were measured.

Figures 14A and 14B. Application launch and project load in Autodesk 3ds MAX - Laptop
The P44 Pro achieved the fastest application launch and project load times in this comparison. Again, the difference in application load times is minor. Project load times showed higher variance with a 22% longer load time between the P44 Pro versus the Crucial P5 Plus SSDs.
Conclusion
When solid-state drives were first released, the performance difference between mechanical and solid-state SATA drives was significant across all drive characteristics. This arguably made the choice of drive simpler, as moving from a mechanical drive to a NAND-based SSD, would, in most instances, improve the user experience.
However, with the range of products and technologies available today, comparisons have become more nuanced, and it is important to identify performance characteristics aligned with well-defined needs.
Storage innovation has continued at an exponential rate, and NAND SSDs can, by design, deliver performance targeted for specific use cases. The Solidigm P44 Pro is designed to deliver performance for demanding workloads that include content creation and gaming.
Based on Solidigm workload analysis, delivering higher performance for predominantly 128 KB reads (to a lesser extent, random 128 KB writes) and a high number of random 4KB reads (to a lesser extent 4 KB writes, with slightly lesser focus on 1 MB reads and writes) will promote an exceptional content creation and gaming user experience.
Based on observed test results detailed in this paper, the P44 Pro delivers over 7000MB/s read and over 6500MB/s write throughput for sequential 128KB workloads. In addition, it achieves over 1.4 million IOPS at a lower latency for random 4KB reads than all SSDs included in this comparison. It delivers consistent performance at peak load and at lower queue depths.
The P44 Pro should, therefore, be considered a dependable choice to deliver an exceptional user experience for gamers and content creators.
Appendix – Testing Configurations
Testing by Solidigm as of [October 2022]
Hardware & Software Configuration – Desktop PC

Hardware & Software Configuration – Laptop

Benchmark Software

Application Software

Footnotes:
[1] Measured numbers within SLC cache buffer using IOMeter. High QD performance based on one worker with QD=64 and random performance based on four workers with QD=64 each. Measured on the S SKU.
[2] A more detailed discussion on gaming and content creation workload can be found at: https://www.solidigm.com/content/dam/solidigm/en/site/products/technology/performance-with-impact/documents/Performance-With-Impact-White-Paper-R2.pdf
[3] A full discussion of the PCMark Quick System Drive benchmark real-world traces and scoring mechanism can be found at https://support.benchmarks.ul.com/en/sup- port/solutions/articles/44002171471-quick-system-drive-benchmark.
[4] A full discussion of the PCMark Full System Drive benchmark real-world traces and scoring mechanism can be found at https://support.benchmarks.ul.com/en/support/ solutions/articles/44002171465-full-system-drive-benchmark.
Notices & Disclaimers:
All information provided is subject to change at any time, without notice. Solidigm™ may make changes to manufacturing life cycle, specifications, and product descriptions at any time, without notice. The information herein is provided "as-is" and Solidigm does not make any representations or warranties whatsoever regarding accuracy of the information, nor on the product features, availability, functionality, or compatibility of the products listed. Please contact system vendor for more information on specific products or systems.
Solidigm classifications are for informational purposes only and consist of Export Control Classification Numbers (ECCN) and Harmonized Tariff Schedule (HTS) numbers. Any use made of Solidigm classifications are without recourse to Solidigm and shall not be construed as a representation or warranty regarding the proper ECCN or HTS. Your company as an importer and/or exporter is responsible for determining the correct classification of your transaction.
Refer to the spec sheet for formal definitions of product properties and features.
Solidigm technologies may require enabled hardware, software or service activation. // No product or component can be absolutely secure. // Your costs and results may vary. // Performance varies by use, configuration and other factors. // Other names and brands may be claimed as property of others. // See our complete legal Notices and Disclaimers. // Solidigm is committed to respecting human rights and avoiding complicity in human rights abuses. Solidigm products and software are intended only to be used in applications that do not cause or contribute to a violation of an internationally recognized human right.
Solidigm and the Solidigm logo are trademarks of Solidigm. Intel is a registered trademark of Intel Corporation. Solidigm is currently keeping the Intel product branding or naming for this SSD. All other trademarks are the property of their respective owners.
©Solidigm 2023. All rights reserved.