Published June 22, 2023
Author Solidigm Team
Article
Here's how Solidigm 670p Drives Stack Up Against the Competition
There’s no question that modern solid state drives (SSDs) provide higher performance and reliability than traditional hard disk drives (HDDs). SSDs provide a significant performance edge and have become more prevalent as the technology has matured. This maturity has led to numerous competing SSD products, price ranges, and performance points, which can make finding the right balance between performance and price difficult.

Benchmark testing demonstrates that the Solidigm 670p performs well in real-world workloads
Solidigm acquired NAND memory and storage technologies from Intel, and is now producing the Solidigm 670p. [1] In recent testing against a number of products from competing manufacturers of both SSDs and HDDs, Solidigm found that the Solidigm 670p provides a compelling balance between price and performance in capacities up to 2TB.
NAND technology increases SSD density and endurance while decreasing cost
As purely electronic devices with no moving parts, SSDs have a proven track record of endurance beyond that of HDDs. HDDs rely on physical rotating disks and moving read/write heads that eventually degrade and fail. Regardless of whether the HDD is reading or writing data, as these parts wear out, data errors begin to occur, and the drives eventually become unusable.
HDDs can also suffer damage from vibration or shock. For example, if a laptop PC with an HDD is dropped, the disks and read/write heads can become misaligned, or the read/write heads can strike the rotating disks, damaging them and the data they contain.
SSDs do not suffer from the same physical limitations as hard drives, as they do not contain any moving parts. In the previous example of a laptop PC being dropped, the SSD would be less likely to suffer harm because it does not contain rotating platters or drive heads that can be damaged.
How NAND flash memory stores data
SSDs have a long development history that dates to the 1970s, but recent SSD advancements have focused on NAND flash memory. Like traditional HDDs, NAND flash memory is a non-volatile storage technology that retains its data even if power is removed from the device. NAND flash memory is divided into memory units called cells. Early NAND-based SSDs used single-level cell flash memory, or SLC technology. This type of NAND contains one bit per cell, and it is characterized by fast read/write performance and high reliability.
Higher-capacity SSDs eventually moved to multi-level cell (MLC) flash memory, which doubled the memory capacity to two bits per cell. MLC flash memory was first demonstrated in the late 1990s and early 2000s. Manufacturers refined their processes such that multiple cells could be stacked, which lead to greater cell density and increased capacity.
Manufacturers continued to expand NAND flash memory capacity by increasing the amount of data a single cell could hold. Today’s SSDs often contain triple-level cell (TLC) flash memory, which manufacturers started shipping in the early 2010s. TLC flash memory provides three bits per cell. Newer quad-level cell (QLC) flash memory increases memory storage to four bits per cell, delivering 33 percent more bits per cell than TLC NAND. The benefit of these flash memory improvements is that the increased memory density increases overall SSD capacity while reducing the cost per gigabyte.
Balancing performance and endurance
Relative to SLC, NAND technologies that store more bits per cell will vary in their performance characteristics. As the number of bits per cell increases, the amount of time it takes to write data to a cell also increases. SSDs configured with TLC NAND flash memory write three bits of information to each cell, whereas QLC NAND-based SSDs require four bits to be written to a cell. Because TLC has a lower number of bits to write to each cell, it is generally faster to write data to TLC NAND than QLC NAND.
SSDs eventually degrade, as the cells that store data have a limited number of program/erase (P/E) cycles. A P/E cycle occurs when data is written to a cell. Each cell loses its ability to hold an electrical charge as it reaches its P/E cycle threshold, which eventually results in the cell becoming unusable. Additionally, more bits per cell equals more writes per cell. SLC and MLC have higher P/E cycle thresholds, while TLC and QLC have lower P/E thresholds.
QLC NAND-based SSDs help overcome cell degradation by distributing P/E cycle wear across a larger number of cells. SSDs based on QLC NAND can spread wear across a larger number of cells due to their increased storage capacity. And while P/E cycles cause cells to eventually wear out, read cycles do not. Data can be read from each cell without the cell degrading, which makes QLC NAND–based SSDs an ideal choice for mixed, real-world workloads.
Solidigm 670p drives: A compelling value for most real-world workloads
Solidigm 670p drives use 144-layer Intel QLC 3D NAND technology, which provides high memory density and performance for real-world computing environments. Available in 512 GB, 1 TB, and 2 TB capacities, Solidigm 670p drives come in an M.2 2280 single-side form factor designed for the PCIe 3.0 x4 with NVM Express (NVMe) interface. This form factor and interface have been widely adopted among manufacturers for most mobile and desktop platforms, which makes Solidigm 670p drives compatible with a wide range of devices.
Solidigm 670p drives provide a high level of write endurance, and they are designed for reliability in mixed-workload environments. Measured in terabytes written (TBW) per 512 GB, write endurance measures how many terabytes can be written to an SSD over its projected lifespan for every 512 GB of capacity. For example, the 512 GB Solidigm 670p has a TBW rating of 185, which means that 185 TB can be written to the drive over its lifetime. That translates into more than 100 GB of data written every day over the course of the drive’s five-year warranty period, which vastly exceeds the amount of data written by many users in typical home or office environments. The TBW also increases as drive capacity increases. The 1 TB Solidigm 670p has a TBW of 370, while the 2 TB Solidigm 670p has a TBW of 740.
Dynamic SLC caching improves performance
QLC flash memory differs from SLC flash memory in that four times more data is written to a QLC flash memory cell than an SLC flash memory cell. Writing more data to each cell takes longer, which makes SLC flash memory faster than QLC. Solidigm 670p drives use QLC flash memory in an SLC-like dynamic cache that helps increase performance. This memory mimics SLC flash memory in that only one bit is stored in each QLC cell, rather than four, which helps increase performance and provide a better, more responsive end-user experience.
Each SSD contains a static amount of SLC cache, in addition to a dynamic SLC cache, as shown in Table 1. A new drive contains the full cache size, while a drive that is mostly full contains no less than the static cache size.
The improved dynamic SLC cache differs from the static SLC cache in that the amount of memory dedicated to the dynamic cache is variable. As more data is written to the SSD, the amount of memory in the dynamic cache can adjust to accommodate the additional data. The dynamic cache can then expand back to its original size as data is deleted.
![Table 1. Fixed and dynamic SLC cache sizes for 512 GB, 1 TB, and 2 TB Solidigm 670p drives]](https://s7d9.scene7.com/is/image/Solidigm/dynamic-slc-graph?ts=1698226219849&dpr=off)
[Table 1. Fixed and dynamic SLC cache sizes for 512 GB, 1 TB, and 2 TB Solidigm 670p drives]
The combination of better caching and increased QLC performance results in higher sequential read and write performance over the previous-generation Intel SSD 660p. The Solidigm 670p provides read bandwidth up to 3,500 megabytes-per-second (MB/s) versus 1,800 MB/s for the Intel SSD 660p, while write bandwidth increases to 2,700 MB/s versus 1,800 MB/s.²
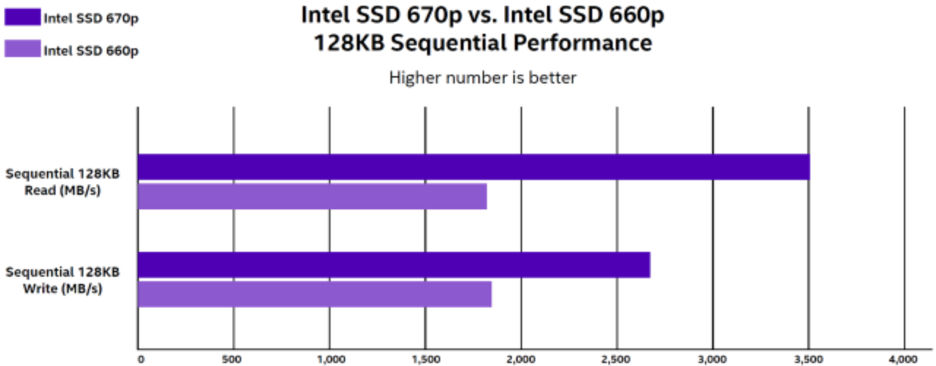
Figure 2. Solidigm 670p read and write performance compared to Intel SSD 660p drives²
Tuned for consumer workloads
Solidigm 670p drives are tuned for low queue depth (QD), which makes them well-suited to consumer workloads, such as gaming and productivity. QD refers to the number of outstanding storage accesses that a workload generates. When an application or operating system needs to read or write data, the SSD provides the requested data back to the application or operating system, or it writes data to its memory.
In general, most consumer applications generate low QDs of four or fewer. Additionally, most real-world workloads primarily generate random reads, meaning applications are reading data from an SSD more often than writing data to it. Solidigm 670p drives are tuned for these common PC usage models that mix low QD with the random read operations that make up most of an SSD’s workload.
Performance Tests
Solidigm recently conducted a performance benchmark comparison of several value-oriented SSDs and a consumer-grade laptop HDD. The SSDs utilize various NAND technologies, including QLC and TLC, while the HDD is a standard drive that rotates at 7,200 revolutions per minute (RPM). The performance testing used industry-standard benchmarking tools and methodologies.
Testing configurations and methodologies
Solidigm engineers ran a series of benchmark tests to simulate different types of common workloads, including PCMark 10 version 2.1.2523.64, CrystalDiskMark 8, the Final Fantasy XIV: Endwalker benchmark, and BAPCo MobileMark 2018 version 1.0.2.46. The engineers also measured the application and file load times of leading office productivity and media tools, including Adobe Photoshop, Adobe Lightroom, Adobe Premiere Pro, Microsoft Word for Microsoft 365, Microsoft Excel for Microsoft 365, and Microsoft PowerPoint for Microsoft 365. Finally, the Solidigm engineers performed a battery rundown test.
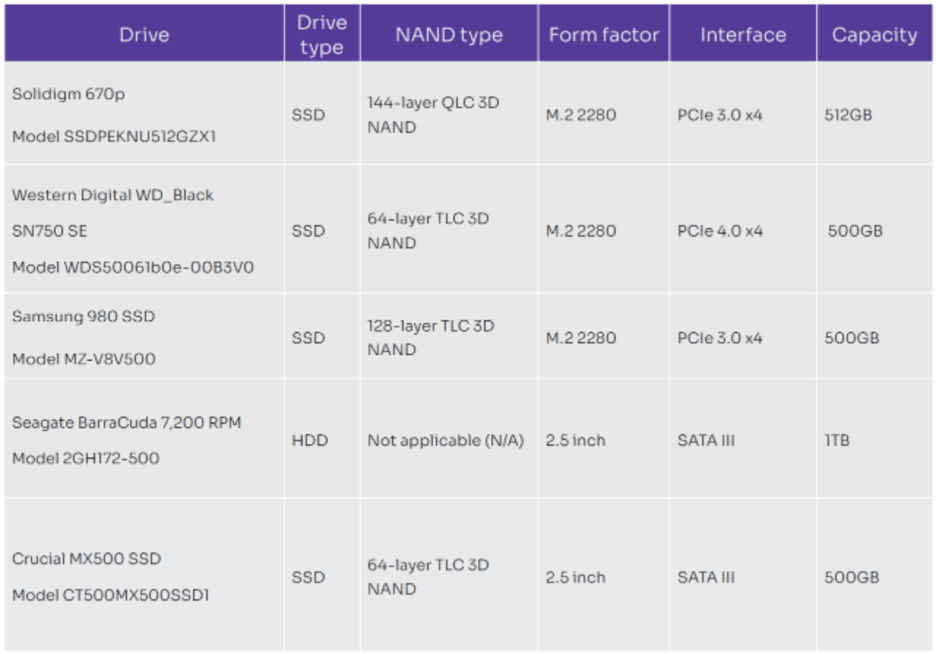
Table 2. Drives used in the Solidigm performance benchmark
The drives were tested using two laptop PCs, both with the following configuration:
• System: ASUS Vivobook
• Processor: Intel® Core™ i7-1065G7 processor
• Memory: 8GB
• Graphics: Intel HD Graphics 6000
• Operating system: Windows 11, build 22000.194, with the latest updates
One laptop was used for the performance benchmark tests, while the second laptop was used for the application launch and battery life tests.
Each benchmark, except for the battery performance and battery rundown tests, was run three times, with the median and mean of the results calculated to determine a ± 5-percent variance for each result. The final result is the median of all three benchmark results.
Prior to running the benchmarks, Solidigm engineers also used Iometer, Cinebench R20 single and multithread, and Cinebench R23 single and multithread to calibrate the laptop PCs.
Benchmark test results
The following sections discuss the performance results for each of the benchmark tests, the application launch and load tests, and the battery-life tests.
PC Mark 10 performance benchmark
PCMark 10 provides a full suite of benchmarks that exercise various PC system components. To test the performance of the drives, Solidigm engineers ran two PCMark storage benchmarks: the PCMark Quick System Drive benchmark and the PCMark Full System Drive benchmark. These benchmarks use real-world traces from common applications and tasks.
The PCMark Quick System Drive benchmark is similar to the PCMark Full System Drive benchmark, but it is a shorter test with a smaller set of real-world traces. The benchmark focuses on file copy operations for various file types using Microsoft Excel, Adobe Illustrator, and Adobe Photoshop. Like the PCMark Full System Drive benchmark, the PCMark Quick System Drive benchmark produces a score that is calculated from the bandwidth and average access-time scores.³
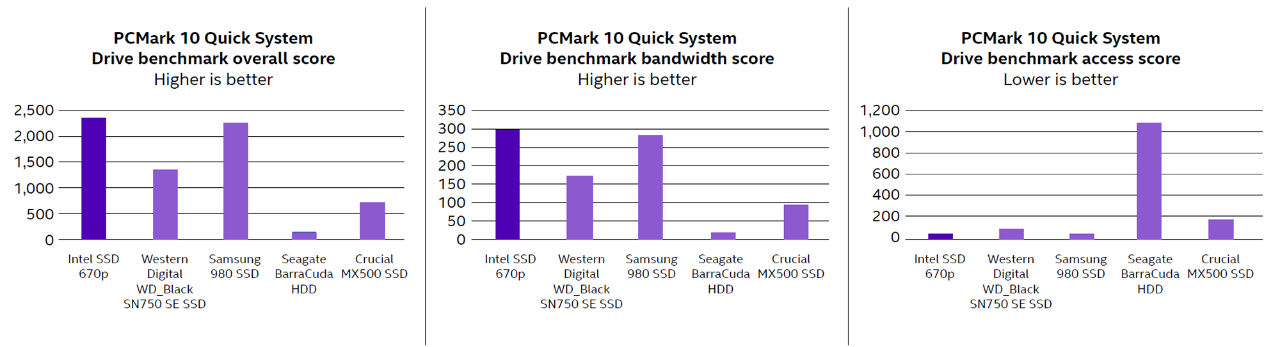
Figure 3. PCMark 10 Quick System Drive benchmark results
The PCMark Quick System Drive benchmark is similar to the PCMark Full System Drive benchmark, but it is a shorter test with a smaller set of real-world traces. The benchmark focuses on file copy operations for various file types using Microsoft Excel, Adobe Illustrator, and Adobe Photoshop. Like the PCMark Full System Drive benchmark, the PCMark Quick System Drive benchmark produces a score that is calculated from the bandwidth and average access-time scores.³
The scores for the PCMark Quick System Drive benchmark show that the Solidigm 670p outperformed all of the other SSDs and the HDD tested. The Solidigm 670p performed 76 percent better than the Western Digital WD_Black SN750 SE SSD, 3 percent better than the Samsung 980 SSD, and 231 percent better than the Crucial MX500 SSD. The Solidigm 670p easily outperformed the Seagate BarraCuda HDD by 1,715 percent.
The PCMark Full System Drive benchmark provides the widest range of real-world traces to fully evaluate SSD and HDD performance. This benchmark is designed to measure performance across the most common SATA and PCIe interfaces, and it includes 23 common application and task traces, such as booting Windows, copying various types of files, and using various Adobe and Microsoft Office applications. The benchmark produces a score that is calculated from the bandwidth and the average access time scores.⁴
CrystalDIskMark 8 performance benchmark
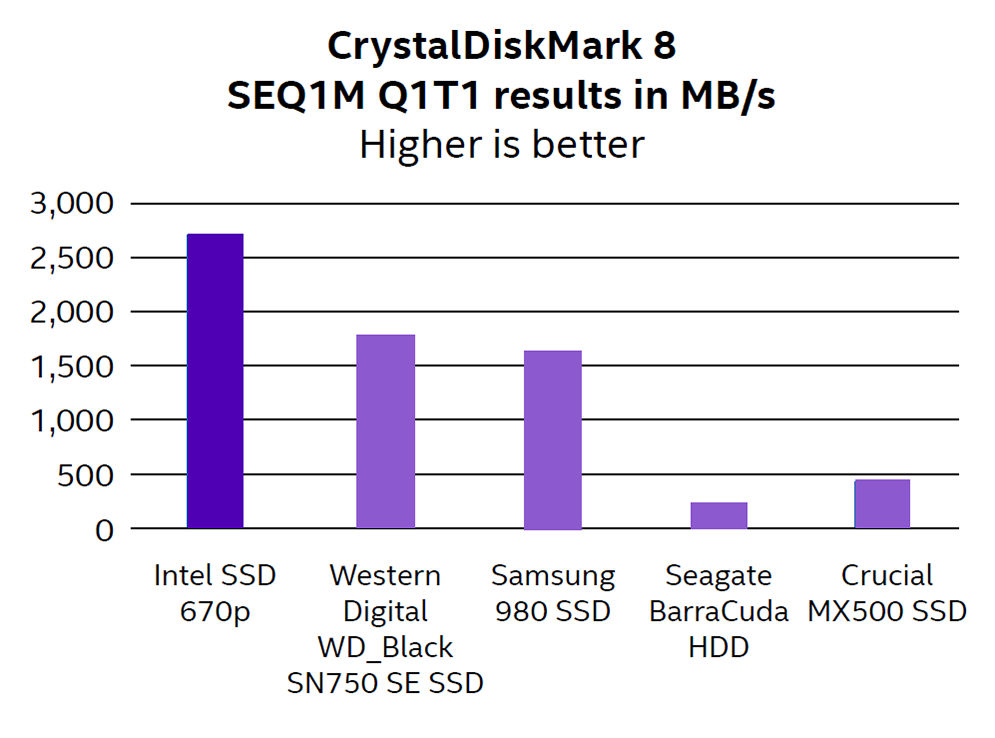
Figure 4. CrystalDiskMark 8 SEQ1M Q1T1 benchmark results
The Solidigm 670p significantly outperformed all of the other drives in the CrystalDiskMark benchmarks. On the SEQ1M Q1T1 MB/s test, the Solidigm 670p performed:
- 47% faster than the Western Digital SSD
- 64% faster than the Samsung SSD
- 550% faster than the Crucial SSD
Additionally, the Solidigm 670p performed 1,369% faster than the Seagate HDD.
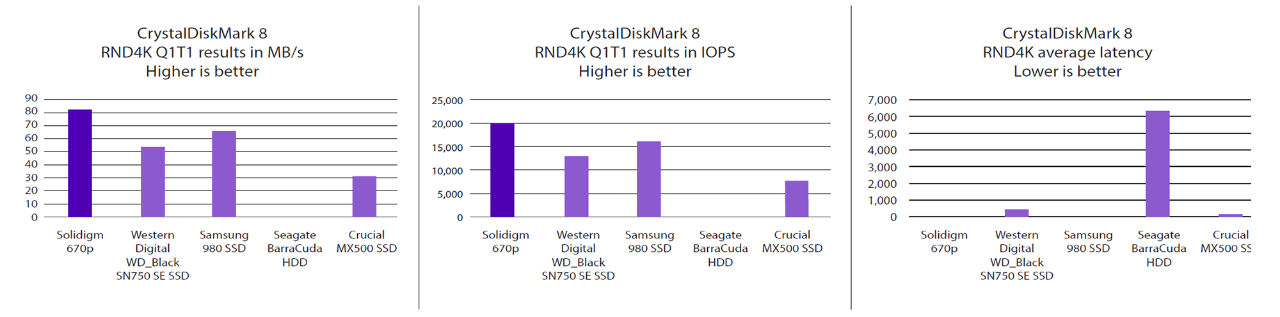
Figure 5. CrystalDiskMark RND4K benchmark results
On the RND4K Q1T1 MB/s and IOPS tests, the Solidigm 670p, with 82 MB/s and 20,032 IOPS, performed:
- 52% faster than the Western Digital SSD
- 24% faster than the Samsung SSD
- 161% faster than the Crucial SSD
- 3,583% faster than the Seagate HDD
On the RND4K average latency benchmark tests, the Solidigm 670p exhibited:
- 34% lower latency than the Western Digital SSD
- 19% lower latency than the Samsung SSD
- 61% lower latency than the Crucial SSD
- 99% lower latency than the Seagate HDD
Final Fantasy XIV: Endwalker official performance benchmark
The Final Fantasy XIV: Endwalker official benchmark is designed to measure how well Final Fantasy XIV: Endwalker will run on a computer, but it is also useful in determining and comparing overall system performance. The software uses maps and playable characters from the game to determine a performance score for the PC and the average framerate. For this benchmark, Solidigm engineers also measured how long the application took to load.
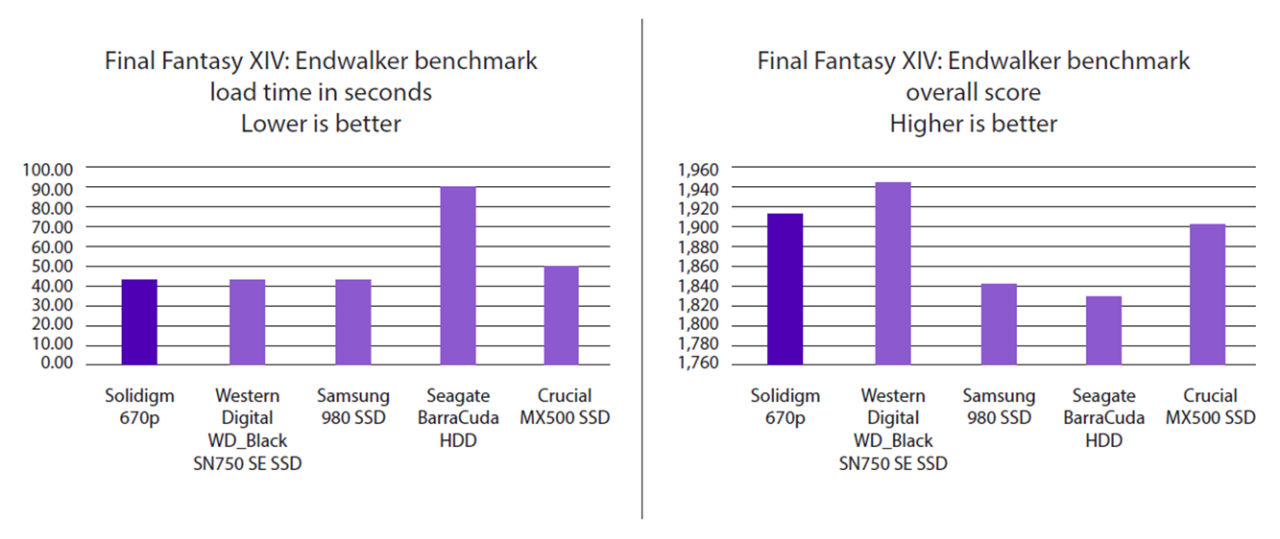
[Figure 6. Final Fantasy XIV: Endwalker official benchmark results]
The Solidigm 670p loaded the benchmark at rates ranging from 1.1 percent to nearly 18 percent faster than the other SSDs, and 112 percent faster than the HDD. For the overall score, the Solidigm 670p helped the ASUS Vivobook perform nearly 4 percent to nearly 5 percent higher than the Samsung SSD and Seagate HDD configurations.
BAPCo MobileMark 2018 performance and battery life benchmark
MobileMark 2018 is designed to measure mobile device performance and battery life. The software provides benchmark tests for multiple scenarios, including productivity, creativity, web browsing, and battery life:
- The productivity scenario simulates productivity application usage, such as word processing, spreadsheet data manipulation, email creation and management, software development, presentation editing, application installation, and file archiving.
- The creativity scenario models digital photo creation, editing, cataloging using artificial intelligence (AI), and digital video editing.
- The web browsing scenario simulates loading and moving between websites and fullscreen local video playback.
- Once MobileMark 2018 completes its tests, the software produces a battery life rating, individual scenario ratings, and an overall performance qualification rating:
- MobileMark 2018 calculates the battery life rating by measuring the battery duration in minutes from a fully charged state to a fully discharged state.
- For each of the three scenarios, MobileMark takes the response-time sum of the scenario tasks on the test system and compares it with the same data from the MobileMark 2018 calibration system.⁶ The sum from the calibration system is divided by the sum from the test system and then multiplied by 1,000. The result is then rounded to the nearest integer.
- MobileMark then uses the scenario ratings to calculate the performance qualification rating, which is the geometric mean of all scenario ratings, rounded to the nearest integer.
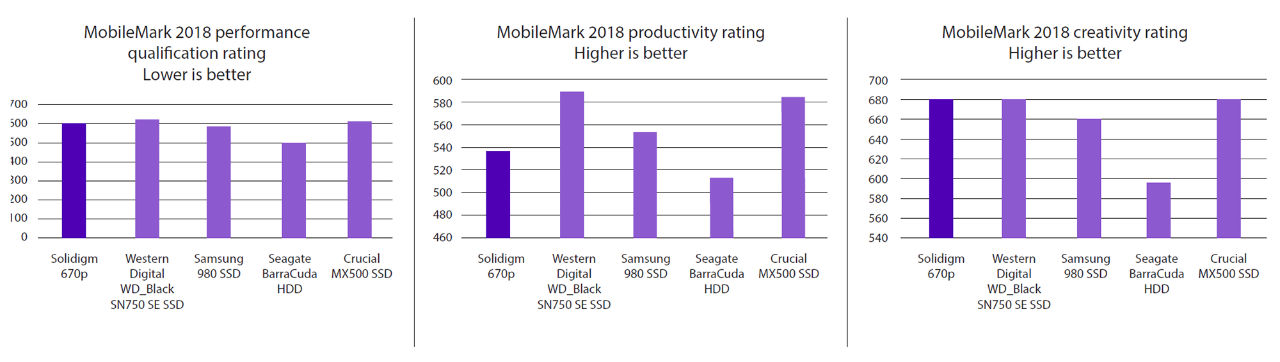
Figure 7. MobileMark 2018 performance qualification, productivity, and creativity ratings
The results show that overall, the Solidigm 670p performs well against the other SSDs and significantly improves upon the HDD performance. The Solidigm 670p pushed the performance qualification rating for the ASUS Vivobook to nearly the top of the group, with only a 3 percent difference between the Western Digital SSD rating. On the creativity scenario rating, the Solidigm SSD performed equal to the Crucial SSD, and it slightly outperformed the other SSDs and HDD by 0.14 to 14 percent, respectively.
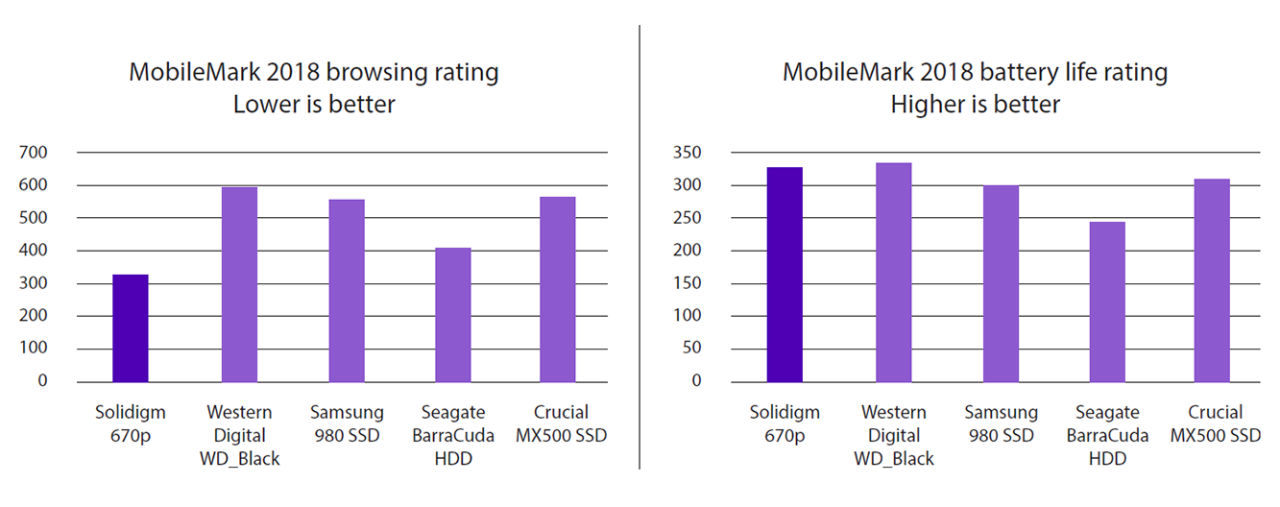
Figure 8. MobileMark 2018 web browsing and battery life ratings]
Application launch and file load times
Solidigm engineers measured the time required to launch popular productivity applications and load sample files. The process included right-clicking on a sample file associated with each application and selecting “Open” from the menu. The applications included Adobe Photoshop, Adobe Lightroom, Adobe Premiere Pro, Word for Microsoft 365, Excel for Microsoft 365, and PowerPoint for Microsoft 365.
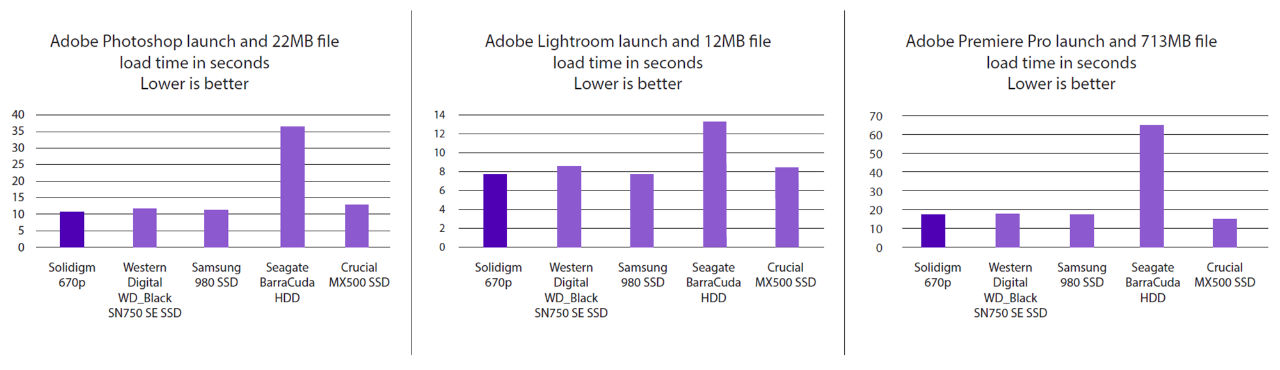
[Figure 9. Adobe Photoshop, Adobe Lightroom, and Adobe Premier Pro launch and file-load test results]
The Solidigm 670p outperformed nearly all of the other SSDs and the HDD loading the Adobe applications and sample files. For Adobe Photoshop, the Solidigm 670p outperformed all of the SSDs by 4 percent to 15 percent and the HDD by 238 percent. For Adobe Lightroom, the Solidigm 670p performed on par with the other SSDs, but outperformed the HDD by 71 percent. For Adobe Premiere Pro, the Solidigm 670p also performed on par with the other SSDs, while outperforming the HDD by 274 percent.
The Solidigm 670p performed well against the other SSDs and consistently outperformed the HDD loading the Microsoft Office 365 applications and sample files. For Word for Microsoft 365, the Solidigm 670p outperformed the Crucial SSD by 23 percent and the Seagate HDD by 321 percent. For Excel for Microsoft 365, the Solidigm 670p matched the performance of the Western Digital SSD, outperformed the Crucial SSD by 10 percent, and outperformed the Seagate HDD by 472 percent. For PowerPoint for Microsoft 365, the Solidigm 670p outperformed all of the SSDs by 12 percent to 45 percent and the Seagate HDD by 534 percent.
For the battery rundown test, Solidigm engineers started playing a high-definition video file, and then measured the time in minutes until the battery capacity was exhausted and the laptop shut off. The test showed that the Solidigm 670p added nearly 100 minutes of runtime over the Western Digital SSD and Seagate HDD, and had similar runtimes compared to the Samsung and Crucial SSDs.
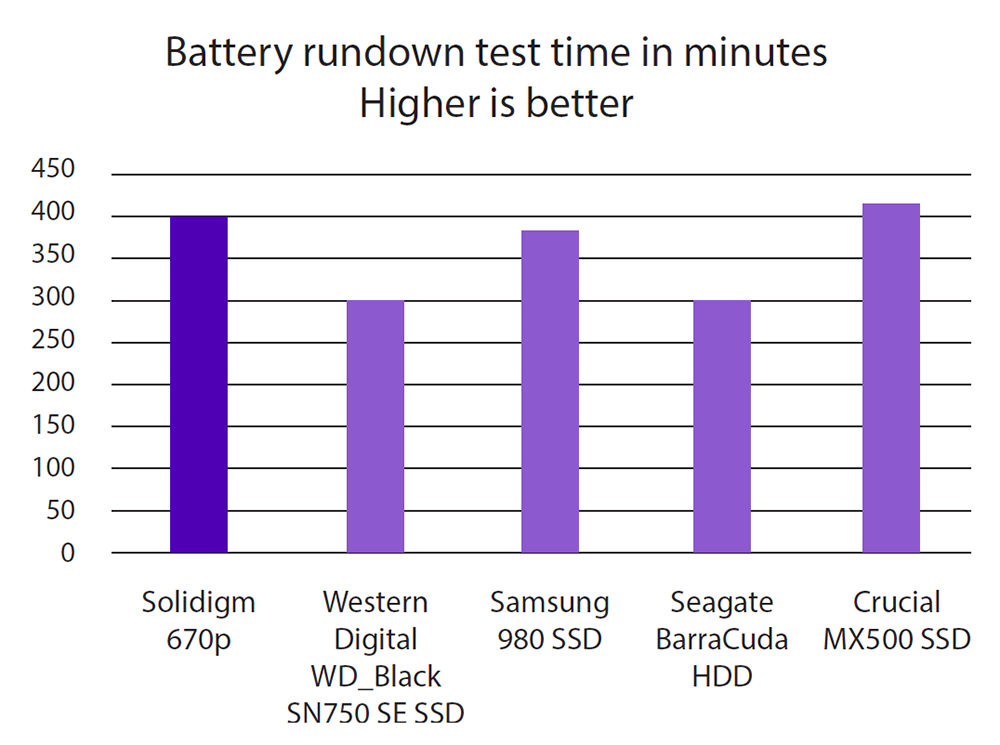
[Figure 10. Battery rundown test results]
The Solidigm 670p provides reliability, real-world performance, and value
The Solidigm 670p utilizes Intel QLC 3D NAND to provide reliability, performance, and value for typical home and office workloads.
QLC 3D NAND provides density and cost improvements over previous types of NAND flash memory, which provides a better price per GB than SLC or TLC drives. With the Solidigm 670p, users get SLC-type speeds and performance improvements provided by the innovative static and dynamic SLC cache.
The Solidigm 670p is also highly reliable, as it provides a high level of real-world endurance, such as the ability to write more than 100 gigabytes daily over its lifespan—more than enough for even the most demanding users.
Solidigm engineers demonstrated that the Solidigm 670p performs well in real-world benchmarks that evaluate mixed workloads, and it often exceeds competing SSDs in performance. Additionally, the Solidigm 670p consistently outperformed the HDD in every benchmark, proving that an investment in SSD technology can help increase productivity by providing faster application response times.
For more information, please visit Client (solidigm.com).
¹ Solidigm™ is currently keeping the Intel product branding for this SSD.
² Intel. “Intel® Solid State Drive 660p and 670p Series Product Specification.” http://ark.intel.com/content/www/us/en/ark/products/series/213704/intel-ssd-6-series.html.
³ A full discussion of the PCMark Quick System Drive benchmark real-world traces and scoring mechanism can be found at https://support.benchmarks.ul.com/en/support/solutions/articles/44002171471-quick-system-drive-benchmark.
⁴ A full discussion of the PCMark Full System Drive benchmark real-world traces and scoring mechanism can be found at https://support.benchmarks.ul.com/en/support/solutions/articles/44002171465-full-system-drive-benchmark.
5 NewCo engineers used the CrystalDiskMark real-world performance profile, performed read (+mix) tests, used default settings for all disks, and used NVMe SSD settings for NVMe SSDs.
6 The MobileMark 2018 calibration system is a Lenovo ThinkPad T480s with an Intel Core i5-8250U processor (four cores, eight threads, 6MB cache, and 1.60 to 3.40 GHz), 14.0 inch 1920x1080 IPS anti-glare display with 250 nit; 8GB DDR4 2,400 MHz (single channel 1 x 8GB) memory, integrated Intel UHD Graphics 620, Windows 10 Pro x64 version 1803, 256GB M.2 NVMe Samsung SSD, a 3-cell li-ion 57 Wh battery, Intel Dual Band 8265 Wireless AC (2 x 2), and Bluetooth 4.1 with Intel vPro® technology. The system has a freshly installed operating system.
7 A detailed discussion of BAPCo MobileMark 2018 methodology and results can be found at https://bapco.com/wp-content/uploads/2019/10/MobileMark_2018_White_Paper_v1.1.pdf.
8 For Adobe Photoshop, the file was the basics_fundamentals sample practice files, which are 22.4MB in size. For Adobe Lightroom, the sample file was get-started-lightroom-cc, which is 12.3MB in size. For Adobe Premiere Pro, the import-file-directly sample project was used, which is 713MB in size. The result was the stop time minus the start time. Information about these sample files can be found at https://helpx.adobe.com/photoshop/how-to/ps-basics-fundamentals.html, https://helpx.adobe.com/lightroom-cc/how-to/get-started-lightroom-cc.html, and https://helpx.adobe.com/premiere-pro/how-to/import-file-directly.html?playlist=/services/playlist.helpx/products:SG_PREMIEREPRO_1_1/learn-path:key-techniques/set-header:import-media/playlist:topic/en_us.json&ref=helpx.adobe.com. For Microsoft Word, the Welcome to Word.docx file was used, which is 700KB in size. For Microsoft Excel, the Financial Samples.xlsx file was used, which is 406KB in size. For Microsoft PowerPoint, the Heavy Equipment Sales.pptx file was used, which is 21.6MB in size. The result was the stop time minus the start time.
Performance varies by use, configuration and other factors. Learn more at www.Intel.com/PerformanceIndex.Performance results are based on testing as of dates shown in configurations and may not reflect all publicly available updates. See backup for configuration details.
No product or componentcan be absolutely secure.
Your costs and results may vary.
Intel technologies may require enabled hardware, software or service activation.
© Intel Corporation. Intel, the Intel logo, and other Intel marks are trademarks of Intel Corporation or its subsidiaries. Other names and brands may be claimed as the property of others